


Data Analyst | Project Manager | Web Developer | Data Storyteller
TYLER SHALVARJIAN

The Teal Desk
Hi, I’m Tyler. I have black belts in SQL, Excel (lookups, pivots, macros, VBA, you name it), Python, ETL processes, presenting to leadership, data governance and quality management, and cross-functional teamwork. And for the stuff I don’t know, I’m an expert Googler and ChatGPTer, a quick learner, and not afraid to ask for help. I’ve worn a lot of hats in my years and I believe I’ll be a strong addition to your team.
As I sit at my Teal Desk reflecting on my contributions and wins, I’m feeling grateful for all the opportunity I’ve been given. I’ve had a ton of fun working on these projects and reports, and I’d love to continue my story with a company that values its people and their strengths, and has confident leadership to follow!
Skills I Have to Offer
-
Tools and Tech
SQL (PostgreSQL, MySQL, SQL Server, Hive, Spark, CTEs)
Tableau, Looker, Power BI, Metabase
BigQuery, Snowflake, Databricks, AWS, Azure
Python (data extraction, forecasting, automation, Pandas, NumPy, Jupyter)
Excel, PowerPoint, Word, Sheets, Slides, Docs
dbt, Airflow, ETL tooling, APIs
Git, GitHub / GitLab, VS Code
HTML, CSS, JavaScript, React
Data and Marketing
Google Analytics 4, Adobe Analytics, Mixpanel, FullStory
A/B Testing Platforms (LaunchDarkly, Google Optimize)
Attribution and funnel tools (in-platform ad reporting)
Tag Management (Google Tag Manager)
SQL- and BI-based reporting (Tableau, Power BI, Looker Studio)
UX/UI, Web and Branding
Figma (primary), Sketch, Adobe XD for interface and UX design
Adobe Photoshop, Adobe Illustrator, Adobe InDesign for graphics and print
Canva for social and quick branding assets
Prototyping and handoff via Figma and Adobe XD
Icon and asset libraries (Font Awesome, Google Fonts)
Business and Domain Tools
Ad Platforms: Google Ads, Meta Ads, LinkedIn Ads, YouTube Ads
Email and Lifecycle: Salesforce, HubSpot, Mailchimp
CRM and Sales: Salesforce and HubSpot
Project and Documentation: Jira, Trello, Asana, Notion, Confluence
-
Dashboarding and reporting analytics
KPI development and ROI analysis
Time-series forecasting and modeling
A/B testing and experimentation
Customer lifecycle and funnel analysis
CDP technologies and customer segmentation
-
UX/UI thinking for dashboards and portals
Design-forward, accessible data visualizations
Client portal and product feature design
Roadmap planning and sprint tracking
Manual and automated QA testing
Technical implementation and documentation
-
Digital marketing and demand generation
Web analytics and campaign performance
B2B SaaS and logistics / supply chain operations
OKR and performance management reporting
HR and recruiting analytics
Customer data platform strategy
-
Cross-functional stakeholder management
Communication and data storytelling
Workshop facilitation and requirements gathering
Leadership and team collaboration
Training, mentoring, and knowledge base creation
Charter / Spectrum Sales Growth Analysis Dashboard
A quick sales investigation using a Tableau Dashboard focusing on the significant growth we've seen from 2022 to 2023, with total sales reaching about $130,000, marking a 13.8% increase. In the video linked below, I walk through our dashboard, highlighting key metrics and trends, including the performance of various product categories like office supplies and binders. I built this dashboard using Tableau’s Superstore Sample Database.
Sales and RevOps Dashboard - NewBusinesses.AI

An additional Tableau Dashboard view of my Tableau Sales Investigation, this time built for NewBusinesses.AI. This dashboard is dual purpose - a two-page dashboard serving both Sales and RevOps. It highlights profitability over time, including Monthly Recurring Revenue (MRR), as well as sales increase, and includes a high-level overview page for fast leadership decision-making.
CT BI Team Roadmap Dashboard
A dashboard for Affirma’s consulting team productivity metrics and project tracking. This dashboard was used across our team for team members and leads to track team capacity and efficiency KPIs. I developed this dashboard and ETL pipeline in partnership with our lead project manager at Meta.
Executive OKR MBR Dashboard
An OKR tracking tool/dashboard serving Meta’s leadership team. This Product Development Plan document (linked) discusses a framework for product development and details dashboard features. I wrote this as part of the requirements gathering phase for the dashboard build out and we used it as a template for tracking product development over the course of the project. It was distributed to all team members and stakeholders (engineers, project managers, data analysts, customers).
Executive OKR MBR Dashboard Query Snippet
This query was a CTE for a portion of the Executive OKR Dashboard. It aggregates tags for objectives pulled from disparate data sources. The goal was to align data sources by data type for use in the Tableau dashboard build. It uses a series of joins and array aggregation functions.
The Mod Report - NHL
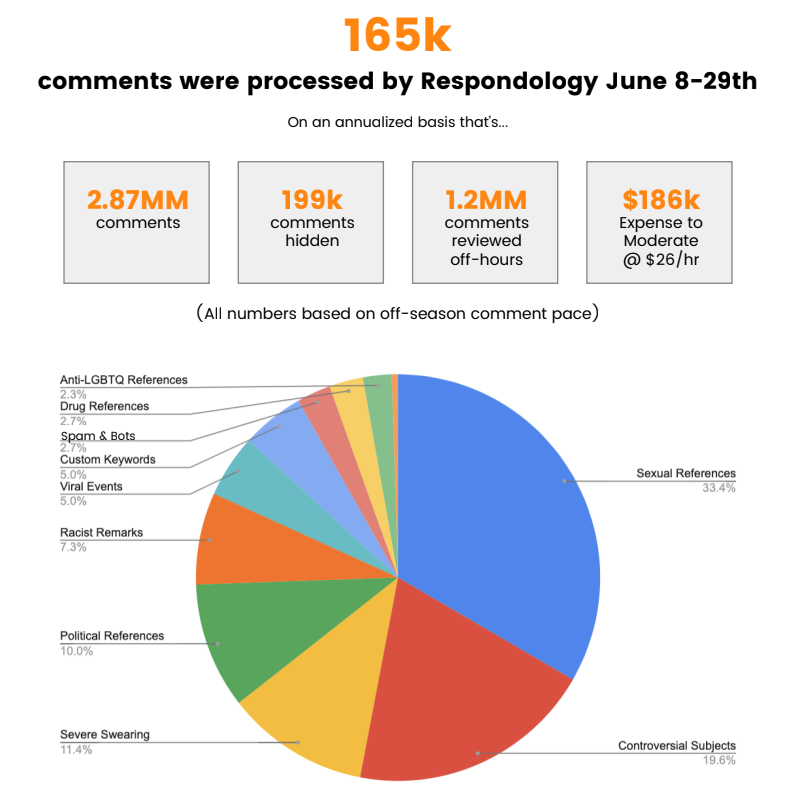
A short document (linked) discussing campaign performance metrics for Respondology’s client, the NHL. I wrote this copy and worked with our CEO to refine it and publish. Well received by the client! With this report’s success, we produced many more of these for our other clients over the years.
Detroit Pistons Case Study

I created The Detroit Pistons Case Study (linked) in coordination with our sales team at Respondology as sales material for approaching the Detroit Pistons as a client. It includes some metrics that could be attained with use of our product. This report helped us land the Detroit Pistons as a client. You’ll notice the design of these reports improved over time. I used InDesign, Google Slides and Figma to draft up reports and wireframes. I like graphic design and do a fair bit of it for clients when developing reports and sales materials.
Contact Me
Interested in working together? Fill out some info and I will be in touch shortly. I can’t wait to hear from you!